- Use package / library "scatterplot3d"
- Otherwise is just like plot(), i.e. basic syntax is scatterplot3d(x,y,z) and options include things like pch, highlight.3d=TRUE, type='l', main = "...", xlim = ..., ylim = ..., zlim = ...
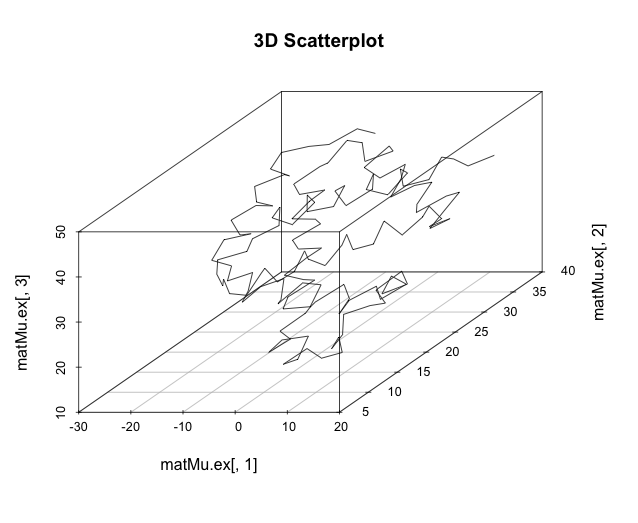
- For example, see file simProtsFromModel.R in my Wang Schmidler / siteDependentTransMatrix directory. Here's an output from that file: