To profile R code, Hadley Wickham's package profvis is pretty good, and easy to use. See the vignette for details.
|
Great article in here by Hadley Wickham on the reshape package. Excellent short read for understanding HOW to think about the format of data. Has the additional benefit of sort of teaching you how to use melt etc.
How to allow a script to set the working directory to the location of that script file. Richie Cotton's answer here:
(REQUIRES use of Rstudio!) Use the commmand: setwd(dirname(rstudioapi::getActiveDocumentContext()$path)) This is for the case where each data frame in the original list is formatted with the same columns (like it was produced in a loop...) 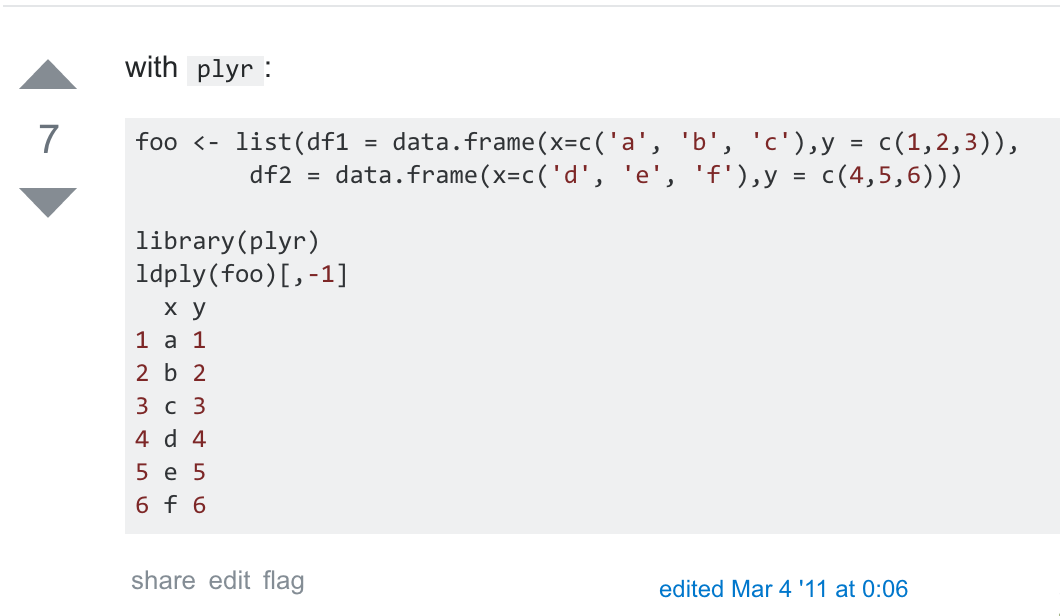 I have what is essentially a Metropolis-within-Gibbs sampler. One or two of the parameters have unconventional steps in their sampling. (I'm talking about my expansion to Challis Schmidler 2012 which used a library of proposals to improve mixing on a couple of the parameters). I suspect I'm seeing poor mixing in some of the other parameters, so I wondered if I could use Stan for those parameters and keep the library-based sampler as well.
Quick Google search reveals ... I'm not sure what. From this post on the Stan Google group, the following quotes are pertinent in answer to a question about (I thought) using HMC together with another type of sampler for one of the parameters. It seems the questioner has either a hierarchical or discrete model (both bad for Stan) and that in the later quotes it appears I could alternate Stan with RWMetropolis. Read on... This page discusses use of the commands saveRDS() and readRDS() as replacements for save() and load()
See these slides. (Reproduced below). Slide 11/68 explains how to include RcppArmadillo. Just install the package 'RcppArmadillo' like a normal package in RStudio. Then New-->C++ file will pull up the C++ file template in RStudio. Replace #include <Rcpp.h> with #include <RcppArmadillo.h> and add in // [[Rcpp::depends(RcppArmadillo)]] and you're all set. I was looking into the use of Stan for Hamiltonian Monte Carlo. On page 23 of the Stan reference (stan-reference-2.9.0.pdf), I found this excellent and brief summary of HMC: HMC accelerates both convergence to the stationary distribution and subsequent parameter exploration by using the gradient of the log probability function. The un- known quantity vector θ is interpreted as the position of a fictional particle. Each iteration generates a random momentum and simulates the path of the particle with potential energy determined [by] the (negative) log probability function. Hamilton’s decom- position shows that the gradient of this potential determines change in momentum and the momentum determines the change in position. These continuous changes over time are approximated using the leapfrog algorithm, which breaks the time into discrete steps which are easily simulated. A Metropolis reject step is then applied to correct for any simulation error and ensure detailed balance of the resulting Markov chain transitions (Metropolis et al., 1953; Hastings, 1970). Immediately after that, the tuning parameters are discussed: Basic Euclidean Hamiltonian Monte Carlo involves three “tuning” parameters to which its behavior is quite sensitive. Stan’s samplers allow these parameters to be set by hand or set automatically without user intervention.
Write your .cpp file, including whatever Boost libraries you need, and including Rcpp:
#include <Rcpp.h> #include <boost/math/common_factor.hpp> // included in BH #include <boost/math/special_functions/bessel.hpp> // ... etc. Between the includes and the other functions, type // [[Rcpp::depends(BH)]] BH is a package that must be installed in R (install.packages(-) and library(-)) (so is Rcpp). Before each function in your .cpp file you need // [[Rcpp::export]] in a line by itself. This allows the function to be accessible from R. This syntax is for an *attribute* in C++. See my file pvm.cpp (in the git .gist below) for an example of everything so far. Once the .cpp file is correctly written, use it from R as follows: > library(BH); library(Rcpp) > sourceCpp('~/.../mypvm.cpp') > mypvm(1,2,3) That's all there is to it! More detailed information at the following links: // - http://dirk.eddelbuettel.com/code/bh.html // - http://gallery.rcpp.org/articles/a-first-boost-example/ // - After "which builds and runs..." at http://stackoverflow.com/questions/16131462/how-to-use-boost-library-in-c-with-rcpp Tricks for efficiently reading large text files into R
from http://cbio.ensmp.fr/~thocking/reading-large-text-files-into-R.html (the following is copied from that website) There are 4 golden rules, which are explained in detail on the manpage of read.
This is the page I always look for over and over again.
UPDATED: Ok, one thing that mitigates this is upping the factor on runif(1) to 1e6 or 1e7.
I apparently don't know enough about how set.seed() works in R. I'm fitting a model to some 2-D data using the EM algorithm. I do the fit a bunch of times (34 in this case) to look at sensitivity to starting values. I calculate AIC for each fit. To ensure I can run the fit again if I need to, I prefaced the call to my EM algorithm function by setting what I intended to be a random seed. The loop looks like this:
The loop starts at 5 because I happened to do 4 fits before realizing I was missing "set.seed()". Never mind that. The point is that the AICs for these fits cycle around (starting with the 5th). Here's a plot of all 34 AICs:
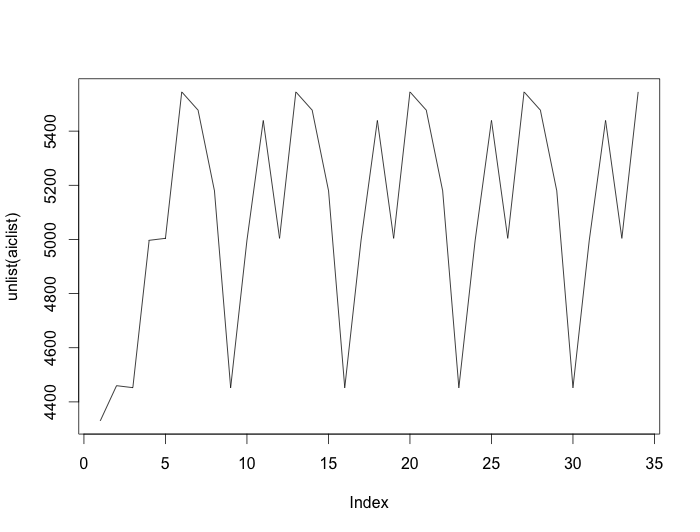
The default random number generator in R is the Mersenne Twister whose period is $2^{19937}-1$. Call that $L$. The plot above could occur if the number of random number generations my call to the EM algorithm uses, call it $N$ - and $N$ must not depend on the number of iterations needed before convergence, since can vary by fit - the plot above could happen if $L/N=7$. But that's impossible as $N$ is nowhere near that high.
What's going on?
From this documentation page. After the following line is executed, some call stack info will print upon reaching an error (or upon clicking the Stop sign during computations)
I tried hilite.me but it didn't really support R code. The best is to use gist.github.com because it keeps all your code snippets around and is just super easy to use:
Here's a Github "gist" of the a piece of C++ code:
And here's a bit of .R code. Easy.
I couldn't figure out how to do this in ggplot when e.g. one of the groups of samples has density far away from the range of the other. But code based on the below does work:
from http://www.statmethods.net/graphs/density.html # Filled Density Plot d <- density(mtcars$mpg) plot(d, main="Kernel Density of Miles Per Gallon") polygon(d, col="red", border="blue") I used it in a context as follows: See "lookAtResults.FUNCTIONS.R" d = density(par.old) plot(d, xlim=xlims, main = plotTitle, xlab=xlab) polygon(d, col=rgb(.5,0,.5,.5)) polygon(density(par.new), col=rgb(0,0,0,.2)) legend("topright", legend=c("old model","new model"), lty=1, lwd=3, col=c(rgb(.5,0,.5,.8), rgb(0,0,0,.4)))
From http://goo.gl/cTnCpr:
In Finder, go to /Library/Frameworks/R.framework/Versions and just delete the version I don't want. rnum is some random number (for the filename "filestr")
filestr = paste('/',rnum,'.save') mainDir = '~/Desktop/' subDir = 'mixcop.EM.iter.DATA/' saveStr = gsub(" ","", paste(mainDir,subDir,filestr)) dir.create(file.path(mainDir, subDir), showWarnings = TRUE) savedat = as.data.frame(list(phi=dat[,1], psi=dat[,2])) save(savedat, file=saveStr) print(paste('Data saved to ',saveStr)) I'm following the instructions at this link. When I get the section Configure the StatET Eclipse plugin, Step 4, bullet 3, I'm using /Library/Frameworks/R.framework/Versions/3.0/Resources/ as the Location for R_HOME. I discovered that by typing .libPaths() into an Rsession, which actually returned a slightly different directory (above but with a /Library/ subfolder added). Eclipse showed an error at the bottom of the current setup dialog box and so I tinkered until I found a path that didn't give an error.
R: setting my directory for saving files Here's some code for setting the "saves" directory now that I've moved my saves to Box Sync instead of Dropbox.
The command savedir = gsub("7/ ","7/",paste('~/Box Sync/Home Folder gjl7/',gsub(" ","",paste('Sync/Duke/research/saves/')))) will give the correct path to the saves directory itself. Then just create a filename e.g. thisfile = gsub(" ","",paste('20140625-em.res.bvm.J0',j,'.reps50.list')) and the final save file path(or load file path, in this example) is loadstr = gsub("saves/ ", "saves/", paste(savedir, thisfile)) Part 1 and Part 2. Also another view here. Another PPT from Ingmar Schuster (Universitat Leipzig) appears to be very good. (attached and viewable below)
Quick example of how, within R, to prepare xtable() tables which:
This code is taken from 20140403-seeJournal.resultstable.R. x.myres = xtable(myres, align='ll|rr')
print(x.myres, include.rownames=FALSE, hline.after=c(0,2,7,12,17,22)) Here's Hadley Wickham on the <-- operator.
link And now something I once wrote on a Coursera thread regarding how I feel about the <-- operator always being taught as better than =. Dan is right and this seems to be taught more often than necessary by people introducing students to R. It's very much a preference thing, but I am a staunch supporter of not recommending <- signs for assignments. (I'm not trying to convert anybody, but just to share my ranting opinion. I never hear anybody express this opinion, but I feel like it makes good sense, so here goes): The problem I have is that we're always taught to use <- because, as Dan says, it "can lead to problems" to use =. Yet, I have been using R for about 5 years and the only case of ambiguity I'm aware of is when using a type of command which is way too advanced for beginning R users to care about in the first place. In fact, I used = sign as assignment for all 5 years and never once had a problem. The advanced command I'm talking about is if you wanted to combine an assignment statement and a function call. In order to do so, the assignment statement needs to be executed with <-. The = sign won't work. Here's an example. You want to call a function with the argument being a uniform random number on (0,1). You could write u = runif(1) # You could also write u <- runif(1) here, of course. That works. myfunction(u) This type of "one-at-a-time" statement execution is totally natural for new R users (ESPECIALLY non-programmers) and will never cause any problems by not using <- for the assignment. But, you could save a line and accomplish your goal by just typing myfunction(u <- runif(1)) # Executes just fine, with no error. myfunction(u = runif(1)) # Causes an error. Just above, the part inside the parentheses of myfunction() evaluates first: a random uniform number on (0,1) is assigned to the variable u. Then, that value is passed to the function myfunction(). This doesn't work with an = sign. Very few people who are new to R - if any - are going to care about doing things like this, so they'll use the first type of coding and be totally fine with using = as an assignment operator, pretty much forever. In year 4 or 5 of my R use I finally asked myself "can I assign a variable in the same line as a function call?" And when I found the answer in a forum, they were clear that <- had to be used rather than =. So I continue to use = for assignments to this day, with no problems. <- is a pain in the butt to type every time I make assignments in R code! Let's make life easier for beginners and just tell them to use =. Incidentally, I just found out that R Studio inserts <- for you if you just type Alt+_ (Alt plus underscore). If I had known this back in the day, maybe I'd have used <- all along... :) |
|||
